
Wednesday, October 19, 2016
Tuesday, October 18, 2016
Things have been sooooooo busy! I am struggling with what I can post on the blog that is not confidential or should be kept private until ready to publish. Hence my minimal posting.
Anyways, reading for my data viz class revealed this gem:
 Wattenberg, M. (2002). Arc diagrams: Visualizing structure in strings. In Information Visualization, 2002. INFOVIS 2002. IEEE Symposium on (pp. 110-116). IEEE.Can you see it? where the arc hits the line that is where certain section of the piece repeat. How beautiful is that??
Anyways, reading for my data viz class revealed this gem:

Friday, September 23, 2016
Visual diary 4

Visual Diary 3
I have this pet project where I want to draw characters with personality and charisma that are as abstract as possible. These are not very abstract, but I want to keep the overall egg-shape as a general outline which is filled in with details. I have a fantasy about another life I get to live where I can delve into printmaking and I make woodcuts and screen prints of these.

Wednesday, September 21, 2016
Visual Diary 2

So this may have very little if nothing to do with data viz. I just drew it because I have so many pictures in my head and I just want to draw them all. I am dreaming of doing fan art these days - especially from the TV and books I am reading. Now I know this has nothing to do with data viz, but I did draw it myself, which is learning in itself. I am interested in drawing using only black and white and this is a challenge - to use a fat pen instead of a fine tip. The challenge is to great a readable graphic with mostly flat colours. You see I had to do white around the sword and crown to get it to read agains the black coat? I also like the challenge of trying to create a sense of texture using the fat pen ehcih can be striking when it works, or completely unreadable when it doesn't.
(Any guess who this Game of Thrones Character is?)
Tuesday, September 20, 2016
Visual Journal 1

Updates and Data Viz
Erm. busy, busy.
So I am taking a Data Viz class and I will probably be focusing on that for my blog this semester, seeing as my research is hardly ready to be seen!
In my class we have to do a visual journal. cool. I am supposed to record images daily and respond to them. cool. So I will do that here. Plus, I will include you in my reflections on some of the readings for the course. Bear in mind this is totally reflective and personal. Be kind.
Jagoda Walny, Samuel Huron and Sheelagh Carpendale. An Exploratory Study of Data Sketching for Visual Representation. Computer Graphics Forum, 34(3) The Eurographics Association and John Wiley & Sons Ltd., 2015.
So I am taking a Data Viz class and I will probably be focusing on that for my blog this semester, seeing as my research is hardly ready to be seen!
In my class we have to do a visual journal. cool. I am supposed to record images daily and respond to them. cool. So I will do that here. Plus, I will include you in my reflections on some of the readings for the course. Bear in mind this is totally reflective and personal. Be kind.
What do you think is the main point of this study?
The main point of this paper is to talk about the transformation that occurs when you write something down. The main point is the idea that the act of writing/creation transforms our thoughts. When we write something down, we process our ideas, and it makes our own thoughts available to us, in a way that is impossible when they are still in our head. This paper suggests that the simplest way to benefit from this idea is to simply write, sketch or doodle our ideas. By externalizing them we can view them, critique them and improve them. In order to improve our ideas, it is best to develop them to the point where they are ready to share with others, as in a presentation or a paper. When we consider others we organize the ideas better and we can understand them ourselves. Writing, and reading your own thoughts is like a loop, where you become a third party to your own thoughts and you can see them in a new way. You can use writing to think.
A. Dix (2008). Externalisation – how writing changes thinking .Interfaces, 76, pp. 18-19. Autumn 2008. http://www.hcibook.com/alan/papers/externalisation-2008/
What practical use can you make of the contents of the paper?
This study could be used as a description of the sketching processes, and a way to describe or examine ones own sketching practice. The study looks at data sketching and identifies a possible connection between abstract representations and analysis of the data, suggesting that as we do visualizations we can experiment with the level of abstraction in our work and the amount of analysis we are doing. It also suggests the benefits of sketching, in that it helps us understand data. It also helps us categorize data visualizations into a range from "value level" to "dimension level" to "Global level", and know the strengths and weaknesses of each. We might stat with value level sketches and work towards dimension and global level sketches, ensuring the analysis we are doing is supported by the data. Sketching also leads to diversity of ideas and this paper shows that even those who are not practiced at sketching can do data visualizations to elucidate data sets.
Monday, July 18, 2016
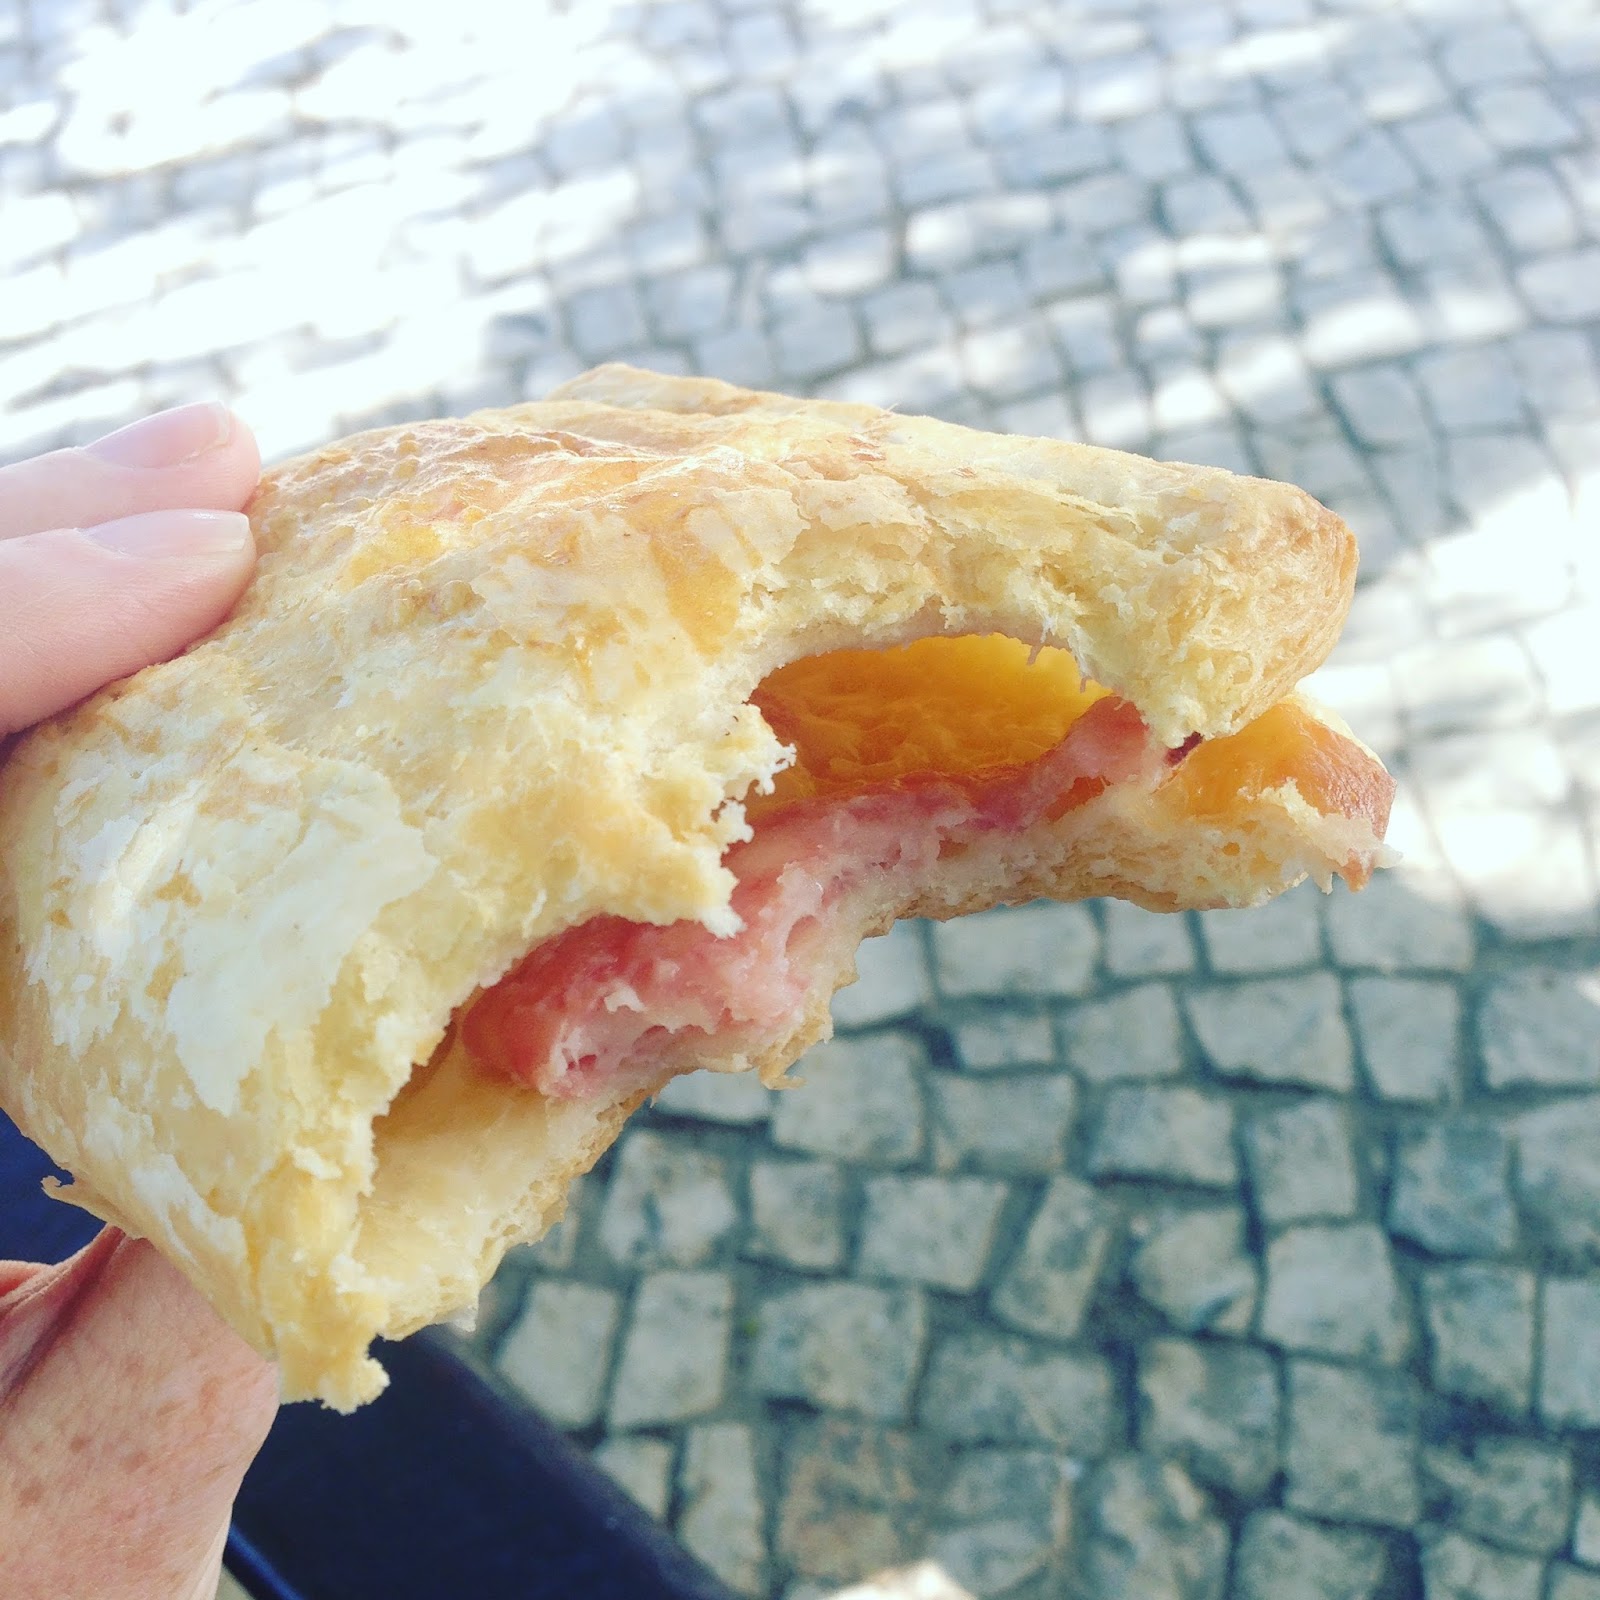
A few words about my trip to Lisbon.
It has been a few weeks since I got back from my trip to Portugal and I am already designing and conducting a whole new usability study so, before I forget all about my vacation I wanted to post some pics. I attended the EAAE/ARCC Conference in Lisbon and presented my paper about the"Forest School".
The conference was held at the Faculty of Architecture and the University of Lisbon, which is located just north of the suburb of Belem, in a beautiful area on the outskirts of the city. The site is high enough on the hill to get a view of the River and at some points, the City of Lisbon itself.
The conference focused on the theme of “Architectural Research Addressing Societal Challenges”. I enjoyed the diverse keynotes, but I really connected with Galen Cranz' presentation called "Re naturalizing the City". It was about the history of urban parks in the United States and the impact of the design of the "chair" on human health. Fascinating. It kind of made you never want to sit in a regular chair again.
I also enjoyed Jan Masschelein's talk - "Addressing societal challenges: Reclaiming and designing (in)´school/ university´". It was a philosophical look at education. He explained a course he taught in Athens where he had students walk along arbitrary lines in the city and record various observations on a map. He talked about the process as a metaphor for learning, how students become knowledgeable through a systematic, facilitated process of careful observation discovery and collaboration.
Just a few of the many wonderful talks I attended:
- Helena Machín, Jorge Almazán A study on the architectural evolution of art museums in japan since the second world war JAPAN
- Deirdre Hennebury Architecture and Pedagogy in the Gallery Context USA
- Milia Lorraine Khoury Architecture “with the Other 90%” an African Story SOUTH AFRICA
- Madlen Simon Future Studio: preparing students for practice in the global context USA
- V. Kaps, C. Martinez, J. Walsche, J. Soolep New Schools of Thought An inductive investigation on tendencies in architectural... LIECHTENSTEIN
- Maria Beltran Rodriguez, Madlen Simon The people’s park: a study of the relationship between design and conviviality in Superkilen USA
- Azza Kamal Re-naturalizing Urban Campuses: An Integrated design and Policy Framework USA


Tuesday, July 12, 2016
The presentation I gave at the EAAE/ARCC Conference, Lisbon 2016
Wednesday, June 1, 2016
How I Map Random but Connected Ideas
Well, there is no doubt I am a visual thinker. I use Indesign as a cognitive mapping tool to arrange random thoughts and ideas. I have been writing approx 600 words a day since March 1st, and then going back and tagging ideas. I then use those tags to create cognitive maps of my thoughts. These may be disconnected and unorganized, but they start to form a picture and slowly but slowly I can start to see some threads that will become the beginnings of a project. This is the map as it stands, but it will definitely change, grow and be altered. Indesign is not a great tool for this, but I haven't found anything else that allows me to represent my ideas this way, so there yo have it. (PS. I like arrows.)


Monday, May 16, 2016
CHI - and Links

I have just returned from CHI in San Jose. CHI is the largest and most prestigious conference in HCI (Human-Computer-Interaction). I attended more amazing lectures than I can count. I am currently going through my bag of various cards and flyers from people I met. Here are some links to some inspiring people doing interesting research:
- https://annikawaern.wordpress.com/
- I met Annika and her PhD student Jon Back in front of their poster presentation for "Designing Children’s Digital Physical Play in Natural Outdoor Settings". I was attracted to the poster because it showed kids playing in the woods with some large, but simple play installations. Their research on play and its role in urban space is interesting to me in relation to my work with the forest school.
 |
| I was captivated by these robots attending the conference alongside the rest of us. It was a surreal and futuristic experience to attend alongside these remotely operated participants. |
Janet Read
- http://www.uclan.ac.uk/staff_profiles/professor_janet_read.php
- I attended Janet's course on research with children. She has extensive experience working on creating technologies in classrooms. As part of her discussion about ethics Janet spoke about classroom dynamics and how to run a study when you are alone with a class of 30 kids. She talked about using stations and having the children themselves act as researchers.
 |
| I was inspired by this talk by Salman Khan about the Khan Academy. So inspired, in fact, that the day I got home our entire family started on the program. I am revisiting grade 8 math with enthusiasm! |
- http://www.bristol.ac.uk/engineering/people/daniel-schien/
- Daniel and the other researchers at the University of Bristol have a focus on sustainability and technology. Working in visualizations, and data analytics they also look into energy consumption of buildings and how data visualizations can impact behaviors.
 |
| This is the San Jose Convention Center on a grey morning. It does get sunny in California FYI. |
- http://www.ecs.soton.ac.uk/people/ec
- Enrico gave a very interesting presentation about a digital data visualization display that shows the temperature inside a building. It was able to indicate when the building was hotter or colder than the policy directive and the study observed behavior changes due to the new information.
- http://www.uts.edu.au/staff/roberto.martinez-maldonado
- Roberto works on visual analytics software for teachers, to help them plan their lessons. His work uses existing information about the effects of classroom techniques on student achievement.
 |
| Market Street in San Jose was great for finding fish tacos! |
Greg Walsh
- http://www.ubalt.edu/cas/faculty/alphabetical-directory/greg-walsh.cfm
- I met Greg in a co-design Special Interest Group for working with children. His work is with inner city kids in Baltimore, helping them learn programming and software design. He also has an interest in architectural co-design and how it has inspired HCI participatory design methods.
- https://ceps.unh.edu/faculty/kun
- Andrew is working with tabletop interactive surfaces for collaborative data analysis and collection. He is facilitating a workshop at a conference coming up directly related to tabletop surfaces (Something I definitely should attend). The conference is in Niagra Falls. http://iss2016.acm.org/
(Not going to lie, this opening presentation made me laugh. The robot on stilts was epic!)
Laura Sanely
- http://dti.cucea.udg.mx/?q=es/directorio/laura-sanely-gaytan-lugo
- I attended two workshops with Laura about doing research with children. She is working on designing games to help with literacy for under priviliged children in rural Mexico.
- https://risweb.st-andrews.ac.uk/portal/en/persons/uta-hinrichs(e5b8b773-91ec-4e1f-8984-a9efa53a2d3e).html
- Uta actually went to this CMD program in Calgary. She is now a lecturer and researcher in Britain and doing research in "physicalizations" with children. She studies how children can understand and learn about data through tangible objects.
- https://www.cs.st-andrews.ac.uk/directory/person?id=mm285
- Michael presented at CHI. He is doing work with eye tracking and adjusting various visual effects that are real time affected by eye movements.
 |
| My brother and I on public transit to CHI!! |
https://books.google.ca/books/about/Human_Computer_Interaction.html?id=k0kBgyCaokAC&source=kp_cover&redir_esc=y&hl=en
This App is really cool. For digitizing visual data. http://ivolver.cs.st-andrews.ac.uk/
One of my favorite Presentations:
Telling stories about dynamic networks with graph comics - Benjamin Bach, Natalie Kerracher, Kyle William Hall, Sheelagh Carpendale, Jessie Kennedy, Nathalie Henry
 |
| One of the best things about California. May is far too chilly for locals to swim in the heated pool. Bonus for Canadians looking for a private swim!! |
Friday, April 8, 2016

Wednesday, April 6, 2016
Public engagement is a relationship building exercise.
Public engagement is a relationship building exercise.
It is not
just about collecting data.
Data changes, it morphs, it adjusts depending on
how it is collected and further as people get to know each other.
Engagement
is about building connections for multiple reasons. Engagement means that we find better data. It means that we ask the right questions, and it means that we build the human resources to actually carry out a new vision. It creates vision. It provides us with more than we put in. Without engagement there is no human network able to conceive of, let alone build something new.
Buildings and environments are physical manifestations of our societal values.
This is why I find over emphasis on online surveys risky. They do very little to create connections and I think it is really difficult
to get important information from them because you have no idea how much people know or
what they are responding to.
My preference at this point is for a multi-tiered approach that includes
data collection, observation, large surveys, followed by interviews with
experts, further face-to-face meetings and usability testing. Small focus
groups are good as well as experiments and developing new methods to test out ideas.
Too much
focus on getting everyone in a room when there is no communal vision or relevant understanding is not
helpful in my opinion, nor is too much reliance on technology, or superficial means to get surface level data.
Some of my current readings include:
Clark, A, and P Moss. 2012. Listening to Young Children: The Mosaic Approach. Jessica Kingsley Publishers.
Burke, Catherine. 2007. “The View of the Child: Releasing ‘visual Voices’ in the Design of Learning Environments.” Discourse: Studies in the Cultural Politics of Education 28 (3): 359–72.
Malczewski, Jacek, and Claus Rinner. 2015. “Multicriteria Decision Analysis in Geographic Information Science.” In Analysis Methods, 331.
Ferretti, Valentina, and Gilberto Montibeller. 2016. “Key Challenges and Meta-Choices in Designing and Applying Multi-Criteria Spatial Decision Support Systems.” Decision Support Systems 84: 41–52.
Wednesday, March 30, 2016

Wednesday, March 23, 2016
Decision Making GIS Software for President.
One
crazy thing I found yesterday was the entire field of "MCDA-GIS" – Multi-Criteria Decision Analysis GIS. Woah. That’s crazy. They have algorithms that do this? I can’t help but have a flash of my
architect friend who, with a look of fear in his eyes said “You are going to
take over the jobs of all these great designers… with computers?” Not only is he afraid of the job loss, but the repercussions of computers making truly impactful decisions for us.
Algorithms that design cities? Now that sounds scary!

This is especially scary for many designers who approach the world through a "creative-human-sticky-complex-organic" process. It sounds like some sort of scene from the Matrix...what could possibly go wrong? But the secret's out, and I am actually excited about it. It’s not that I am a megalomaniac hell-bent on world domination through digital GIS… (though it does sound like a good plot twist)…It’s just that I can see how this type of thing would be so darn useful… AND particularly useful in a participatory process.
In my experience the trickiest parts of a participatory process is having a bunch of people come to your meeting (some of them keen to help, the other half keen to yell at everyone)… and you try to figure out some sort of way that they can contribute. Usually, they discuss, share ideas, maybe we write it down, maybe we have break-out groups, that’s all good. But about three quarters of the way through a meeting the frustration starts to set in. People have given up their time and poured out the knowledge, but the opposing ideas and the conflicting viewpoints start to make the whole thing feel futile. Feeling futile is the last thing anyone needs. That hopelessness and giving-up can single-handedly destroy a participatory process.
To remedy this, the public should be seen (and used) as problem solvers. In my experience, the people I talk to about a project and who want to come out to participate are people of capacity. Also in my experience, those who come with a chip on their shoulder and those who are used to complaining as a mode of interaction, typically transform when they are given tools to solve problems. If instead of soapboxes, people are encouraged to THINK, this can change the dynamic of a meeting. It can also mean that complainers and those who don’t like to actually do anything useful will probably leave. But then that's not a bad thing anyways. Most people are not used to being active agents in the creation of their environment. They are treated like walking opinions and so they just spout out opinions.
For people to be able to problem solve, they need information, and tools. That is where I think simultaneous decision-making GIS software can be useful. As far as I can see this software still requires input. It needs you to give all the opinions and options and criteria. You also need to incorporate maps and spaces and all the information you can. If part of the number crunching can happen then and there and people can see what the results of their contributions are, it can lead to more informed discussion, it can reduce the options down to a couple viable ones that people can choose between. Helping people see some clarity in the muck will go a long way in encouraging participatory processes. I think it will also give groups a clearer vision of how their contributions actually lead to a result. The key is that the process is transparent and one can see how minor choices are affecting the whole.

Smith, Duncan. 2016. “Online Interactive Thematic Mapping: Applications and Techniques for Socio-Economic Research.” Computers, Environment and Urban Systems 57: 106–17.
Algorithms that design cities? Now that sounds scary!

Malczewski, Jacek, and Claus Rinner. 2015. “Multicriteria Decision Analysis in Geographic Information Science.” In Analysis Methods, 331.
This is especially scary for many designers who approach the world through a "creative-human-sticky-complex-organic" process. It sounds like some sort of scene from the Matrix...what could possibly go wrong? But the secret's out, and I am actually excited about it. It’s not that I am a megalomaniac hell-bent on world domination through digital GIS… (though it does sound like a good plot twist)…It’s just that I can see how this type of thing would be so darn useful… AND particularly useful in a participatory process.
In my experience the trickiest parts of a participatory process is having a bunch of people come to your meeting (some of them keen to help, the other half keen to yell at everyone)… and you try to figure out some sort of way that they can contribute. Usually, they discuss, share ideas, maybe we write it down, maybe we have break-out groups, that’s all good. But about three quarters of the way through a meeting the frustration starts to set in. People have given up their time and poured out the knowledge, but the opposing ideas and the conflicting viewpoints start to make the whole thing feel futile. Feeling futile is the last thing anyone needs. That hopelessness and giving-up can single-handedly destroy a participatory process.
To remedy this, the public should be seen (and used) as problem solvers. In my experience, the people I talk to about a project and who want to come out to participate are people of capacity. Also in my experience, those who come with a chip on their shoulder and those who are used to complaining as a mode of interaction, typically transform when they are given tools to solve problems. If instead of soapboxes, people are encouraged to THINK, this can change the dynamic of a meeting. It can also mean that complainers and those who don’t like to actually do anything useful will probably leave. But then that's not a bad thing anyways. Most people are not used to being active agents in the creation of their environment. They are treated like walking opinions and so they just spout out opinions.
For people to be able to problem solve, they need information, and tools. That is where I think simultaneous decision-making GIS software can be useful. As far as I can see this software still requires input. It needs you to give all the opinions and options and criteria. You also need to incorporate maps and spaces and all the information you can. If part of the number crunching can happen then and there and people can see what the results of their contributions are, it can lead to more informed discussion, it can reduce the options down to a couple viable ones that people can choose between. Helping people see some clarity in the muck will go a long way in encouraging participatory processes. I think it will also give groups a clearer vision of how their contributions actually lead to a result. The key is that the process is transparent and one can see how minor choices are affecting the whole.

Smith, Duncan. 2016. “Online Interactive Thematic Mapping: Applications and Techniques for Socio-Economic Research.” Computers, Environment and Urban Systems 57: 106–17.
Subscribe to:
Posts (Atom)